The supply of Westside detached homes in January is unchanged from December (652) and up 6% compared to January 2018. Westside detached home sales (demand) this January were down 6% from December (34 from 32) and down 23% compared to 44 sales in January 2018. January sales are down 61% from the 10 year January average of 87 sales.

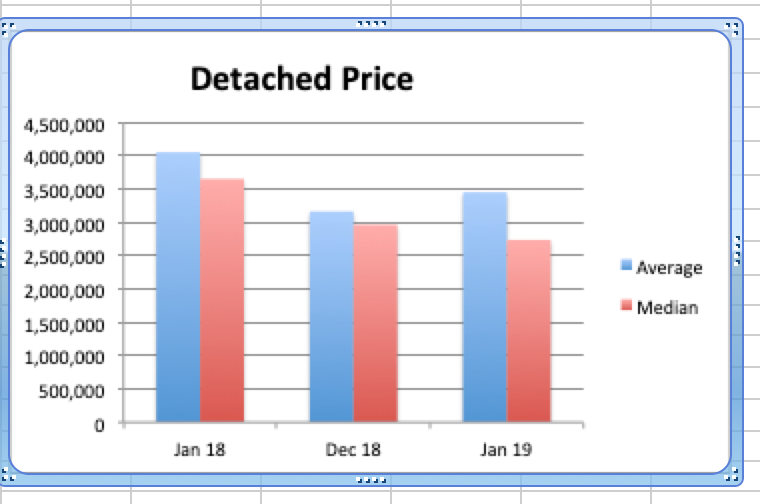
Months of Supply (MOS) was down 6% from last month to 19.2 and up 37% from 14 in January 2018. (Usually a balanced market is in the range between 4-7 MOS with prices rising below 4 MOS and falling above 7 MOS). With MOS at 19.2, the average detached home price has increased 9% to $3.449M. The median price however was down 8% to $2.735M from $2.962M last month. This is a drop of 24% on average & 29% on median from the peak in 2017. If demand stays low, MOS will stay high and we should see continued downward pressure on prices.
The highest sale price for a Westside detached home in January was $8.388M. The lowest price was $1.7M. Of those sales, 3 received the asking price or more and 31 sold below the asking price. The implication of this is that with a sufficiently attractive (low) asking price we can still generate multiple offers.

Westside apartment supply increased 9% to 1193 units from 1094 units in December but this is up 284% from the 568 listings we had in January 2018. At the same time, demand decreased 4% to 133 sales in January from 139 sales in December and this is down 45% from 243 sales in January 2018.
MOS in January is up 14% to 9 from 7.9 in December and up 284% from 2.3 last January 2018. The average price decreased 3% to $912K from $944K in December and was down 24% from January 2018. The median price increased 1% to $745K from $755K in December and is down 24% from last January. Both average and median prices are down by 24% & 14% from the peak of $1.199M and $880K in January 2018.


Westside townhouse supply decreased 24% this December to 182 homes from 240 in November but that's up 43% from 127 in December 2017. Demand in December is down 38% to 18 sales from 29 in November and down 31% from 26 sales last December 2017. With supply and demand both down the current MOS increased to 10.1 from 8.3 in November and from 4.9 in December 2017. Average prices increased 2.5% to $1.275K from $1.244K in November and were down 23% from $1.663M last December 2017. Median prices increased 9% to $1.31M from $1.2M in November and are down 19% from $1.61M in December 2017. As with apartments, townhouse prices are down (29% average and 14% median) from the peak prices last January 2018.


Detached, Attached and Apartments on the west side are still experiencing price reductions and while this is creating good buying opportunities, many buyers continue holding off in anticipation of further declines as 2019 could be in for some further price softening.
The Real Estate Board of Greater Vancouver (REBGV) reports that residential property sales in the region dropped 39.3% to 1,103 this January from 1818 sales in January 2018. January's sales were 36.3% below the 10-year January sales average and the lowest since 2009.
The total number of properties currently offered on the MLS® system in Metro Vancouver is up 55.6% from January 2018 to 10,808.
For all property types, the sales-to-active listings ratio for December 2018 is 10.2%. By property type, the ratio is 6.8% for detached homes, 11.9% for town homes, and 13.6% for apartments.
Downward pressure on home prices occurs when the ratio dips below the 12% mark for a sustained period, while upward pressure occurs when it surpasses 20% over several months.
It is important to keep a global perspective these days and Vancouver is not the only place where the real estate market is retracting; Toronto sales & prices are also down. Beijing & Shanghai prices are off. London prices have fallen 2 years in a row. Hong Kong prices are off. Singapore prices are off and even in Sydney Australia prices are off.
A Bloomberg article Jan.3rd suggests there are some common factors continuing to depress prices in all these areas include government regulations on financing (stress test requires qualifying at 200 basis points above current rates, decreasing loan to value ratios, increasing interest rates, and increased property transfer taxation), stock market uncertainties & flagging Chinese demand everywhere due to the Chinese government restricting cash outflows from China.
The Financial Post today said Canada's main financial regulator is under increasing pressure from banks and mortgage industry lobbyists to back off the stress test requirements for borrowers in order to reduce the number who are being forced to borrow from loosely regulated private lenders. The regulator is not inclined to change it as it was only instituted 13 months ago. I wonder how depressed they need the market to become before they make changes.
The bottom line is that listing supply is increasing while home buyers are still waiting in anticipation of further declines.
This is a Buyers market if there ever was one and many homes are selling well below assessed value even with the new assessments.
The question remains as to how our market responds this spring.
Click on the links at the top right of the newsletter for all the Westside Graphs.
Please call me at any time for a considered response to any and all of your real estate questions.
Happy Chinese New Year (year of the Pig) and all the best for 2019!
Best regards,
Stuart