The supply of Westside detached homes in December was 555, down 13% from 637 in November and down 15% compared to 652 in December 2018.
Westside detached home sales this December decreased 12% from November (58 vs 66) but were up a whopping 81% compared to 32 sales in December 2018. Detached home sales are down 23% from the 10 year December average of 75 sales.

Months of Supply, (MOS) was down slightly from last month to 9.6 from 9.7 and down 53% from 20.4 in December 2018. (Usually a balanced market is in the range between 4-7 MOS with prices rising below 4 MOS and falling above 7 MOS). The Dec average price increased 18% to $3.454M and the median detached home prices remained unchanged at $3.015M. If demand stays high, MOS will stay low and that usually creates upward pressure on prices. Current prices are down 24% on average & 22% on median from the peaks in Oct 2017 and Jul 2017.
The highest sale price for a Westside detached home in December was $13.4M. It was on the market for 375 days before it sold. The lowest price was $1.59M. It was on the market for 408 days before it sold. Of the 58 December sales, 3 received the asking price or more and 55 sold below the asking price.


Westside apartment supply decreased 21% in December (909 vs 1158) and this is down 17% from the 1094 listings we had in December 2018. At the same time, demand decreased 15% 260 sales v. 305 sales in November but this is up 87% from 139 sales in December 2018.
MOS in December decreased to 3.5 from 3.8 in November and is down 56% from 7.9 last December 2018.
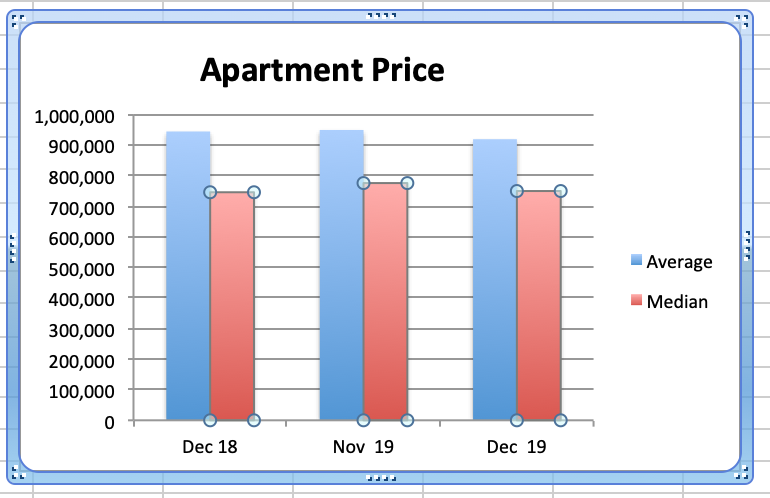
The average price decreased 3% to $918K in December v. $948K in November and was down 3% from December 2018. The median price decreased to $749K v $775K in November and is up minimally from last December. Average and median prices are down by 23% & 15% from the peak of $1.199M and $880K in January 2018.

Westside townhouse supply decreased 18% this December (214 vs 260) from November but that's up 18% from 182 in December 2018. Demand in December is up 9% to 37 sales from 34 in November and that is up 106% from 18 sales last December 2018.
With supply down and demand up, current MOS decreased to 5.8 from 7.6 in November. That is down 43% from 10.1 in December 2018.
Townhouse average prices in December were up 9% to $1.37M from $1.26M in Nov. and were up 8% from $1.27M last December 2018. Median prices increased 2% to $1.262M from $1.238M in November but are down 4% from $1.31M in December 2018. Both average and median prices are down by 24% & 17% from the peak of $1.8M and $1.5M in January 2018.


Average & median prices on the west side are still well below the peak and that is creating good buying opportunities. Detached home prices, creeping up since Feb. this year, are still off 24 & 22%. Apartments are still off 23 & 15% and Attached Homes are off 24 & 17%, so all appear still to be extraordinarily good value.
The Real Estate Board of Greater Vancouver (REBGV) reports that total residential sales and listings for 2019 were 20.3% & 7.6% below the 10 year average.
The typical pattern of seasonal increase in sales in the spring did not show up in 2019 due to buyer's low confidence and their desire to see how prices would react to the mortgage stress test, all the new taxes and other policy changes.
The second half of the year may have seemed better but the numbers were still well below the 10 year averages.
The Real Estate Board of Greater Vancouver (REBGV) reports that residential property sales in the region increased 88.1% to 2016 this December from 1072 sales in December 2018. December 2019 sales were 9.5% above the 10-year December sales average.
The total number of properties currently offered on the MLS® system in Metro Vancouver is down 16.3% from December 2018 to 8,603. This is down 20.1% from last month.
For all property types, the sales-to-active listings ratio for December 2019 is 23.4%.
Downward pressure on home prices occurs when the ratio dips below the 12% mark for a sustained period, while upward pressure occurs when it surpasses 20% over several months.
So while regional numbers are nearing the historical 10 year averages, westside properties are still below the mark making them better relative value. Many sellers are still asking too much to generate offers while serious buyers are finding the sellers who are sharply priced and are buying those homes.
The new assessed values will reflect the new pricing reality and encourage sellers to price accurately if they want to sell.
Government policy continues to hinder home sales activity and erode homeowner equity. The many special interest groups and politicians with pet projects continue to expand government budgets at the expense of business and home owners.
Economics 100 should be a required course for all politicians.
Frank O'Brien wrote a good article in Western Investor ;
Click on the tab "Vancouver Westside Stats" for all the Westside Graphs.
Please call me at any time for a considered response to any and all of your real estate questions.
Happy New Year and all the best for 2020!
Best regards,
Stuart