This representation is based in whole or in part on data generated by the Real Estate Board of Greater Vancouver which assume no responsibility for its accuracy.
Information YTD January 2021
NUMBER OF SALES
YTD 2021: 67
2020: 905
2019: 734
2018: 669
2017: 1045
2016: 1572
2015:2001
2014: 1765
HIGH / LOW
YTD 2021: $9,628,000 /$1,720,000
2020: $27,000,000 /$1,430,000
2019:$15,500,000 / 1,160,000
2018:$26,000,000 / 1,400,000
2017:$18,500,000 / 1,500,000
2016:$31,100,000 / 1,395,000
2015:$22,000,000 / 1,048,000
2014:$18,500,000 / 877,710
AVERAGE
YTD 2021: $3,750,289
2020: $3,475,552
2019:$3,212,573
2018:$3,658,900
2017: $3,990,644
2016:$3,997,650
2015:$3,241,368
2014: $2,789,923
MEDIAN
YTD 2020: $3,300,000
2020: $3,046,000
2019: $2,850,000
2018: $3,150,000
2017:$3,435,800
2016: $3,520,000
2015:$2,850,000
2014: $2,400,000
Want more stats? Dig a little deeper into the Westside sub-areas listed to the left of this page or see active listings, recent sales, local market statistics and more with your FREE customized Market Snapshot Report. Sign up here.
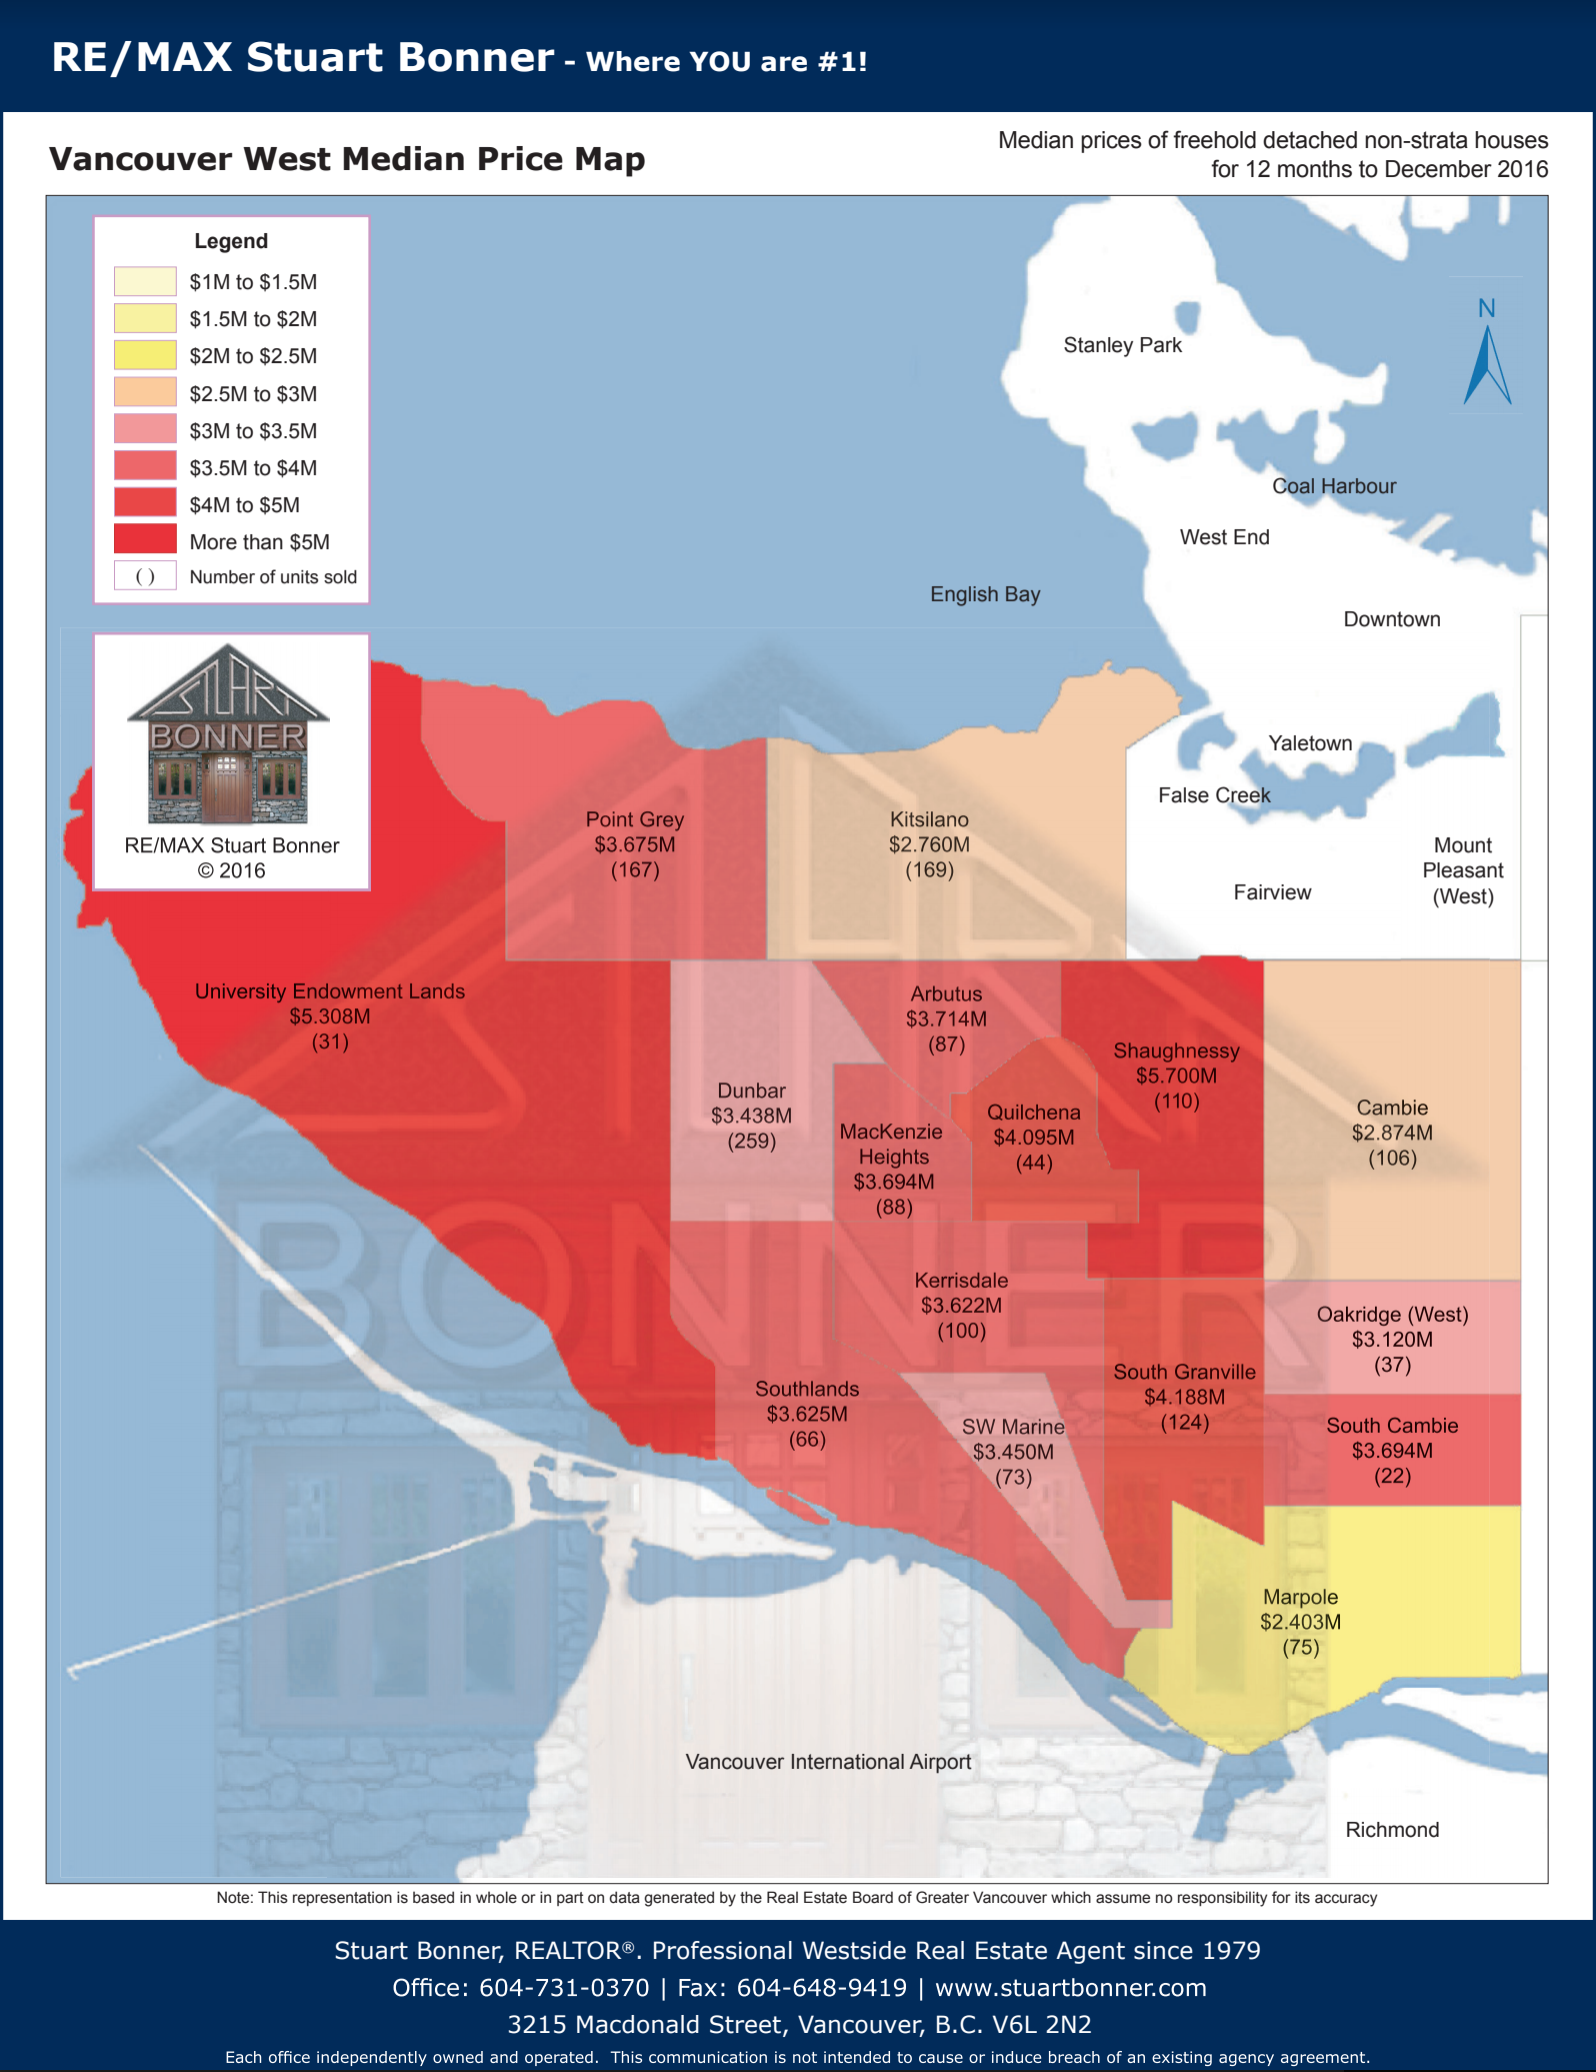
Where is Vancouver's West Side? If you're not familiar with Vancouver, there's a whole lot of "West" here. There's the "West End" (west of the downtown peninsula), West Vancouver (west of North Vancouver), and the West Side (also known as "Westside Vancouver" or "Vancouver West"!)
Whether you are buying or selling, we have a network of experienced RE/MAX REALTORS® not only in other parts of Vancouver, but worldwide. We can refer you to a real estate professional in your location or destination -contact us