I hope you and your family are continuing to stay safe and healthy and adjusting to the gradual relaxing of restrictions.
The supply of westside detached homes in April was 447, down 8% from 486 last month in March and down 39% compared to 737 last year in April 2019.
Westside detached home sales this April decreased 65% from March (37 vs 106) and were 39% lower than April 2019. Detached home sales are down 74% from the 10 year April average of 142 sales.
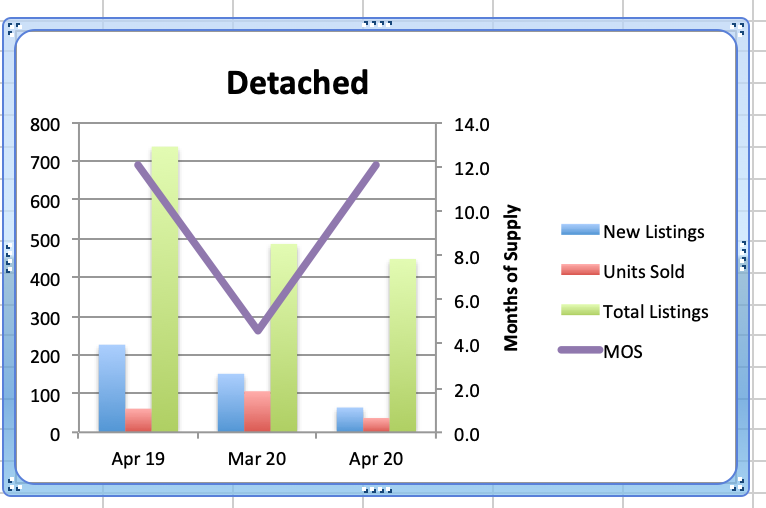
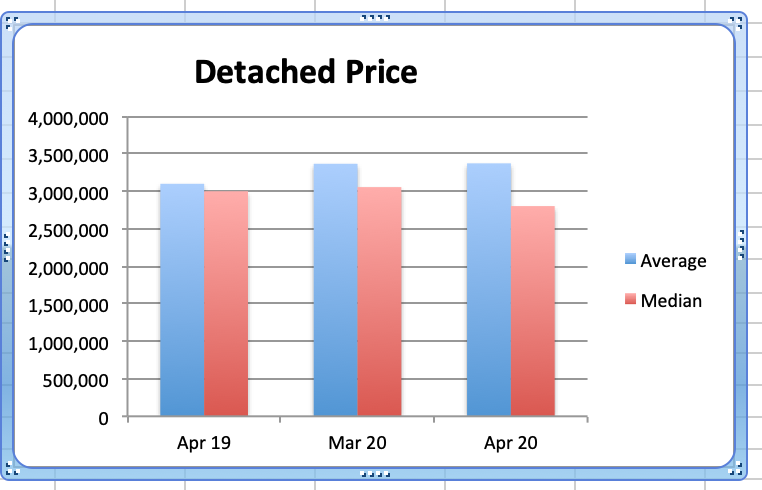
Months of Supply, (MOS) was up 164% from last month to 12.1 from 4.6 and unchanged from April 2019. (A balanced market used to be in the range between 4-7 MOS with prices rising below 4 MOS and falling above 7 MOS but in the last couple of years that seems to have shifted and now appears to be 8 to 10 MOS). The April average price was basically unchanged from March at $3.366M and the median detached home prices decreased 8% to $2.802M. Current prices are down 26% on average & 27% on median from the peaks in Oct 2017 and Jul 2017.
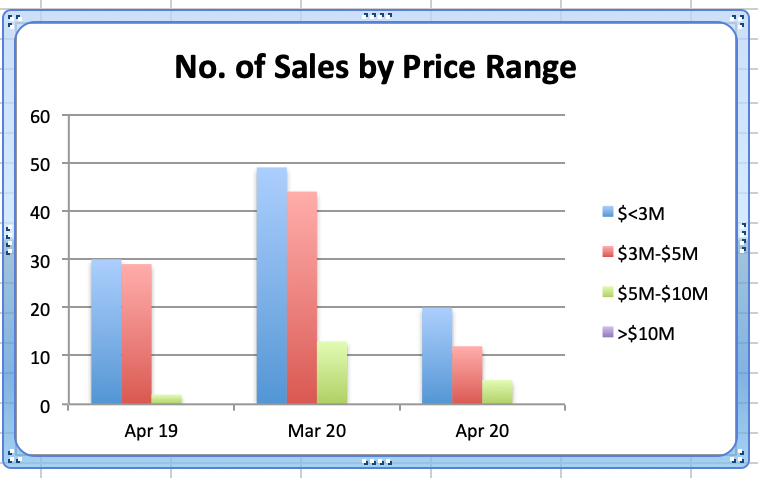
The highest sale price for a Westside detached home in April was $8.3M. It was on the market for 320 days before it sold. The lowest price was $1.43M. It was on the market for 86 days. Of the 37 April sales, 5 received the asking price or more and 32 sold below the asking price.
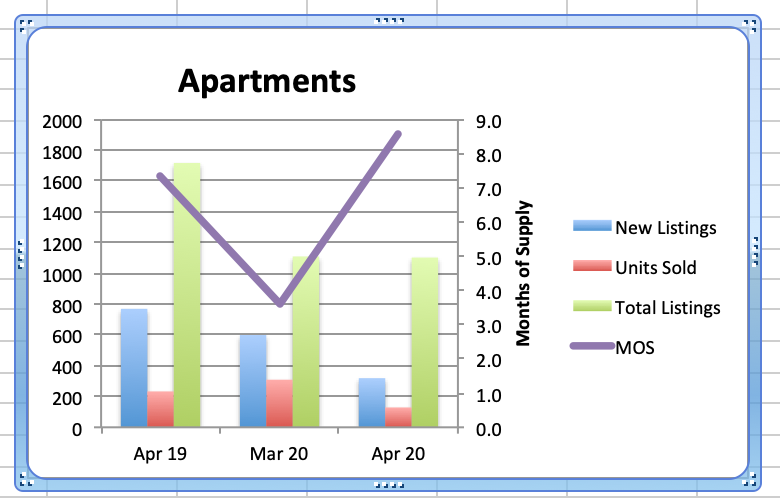
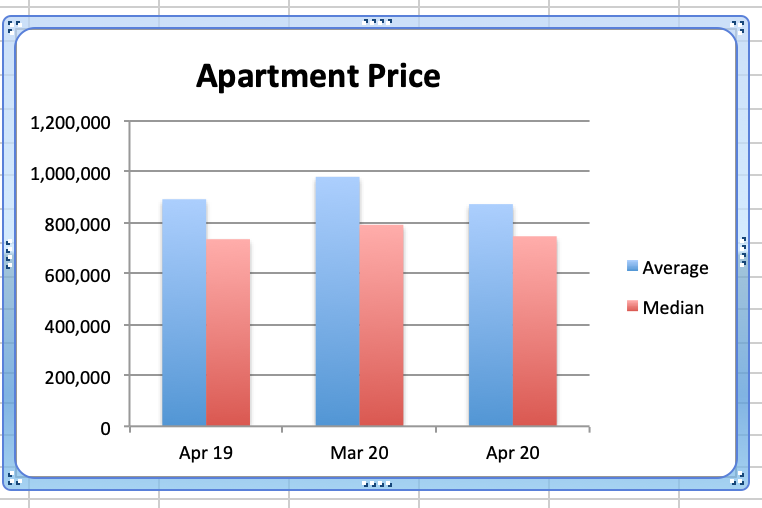
Westside apartment supply remained basically unchanged in April (1102 vs 1109) but this is down 36% from the 1716 listings we had in April 2019. At the same time, demand decreased 58% 129 sales v. 309 sales in March and this is down 45% from 233 sales in April 2019. Apartment sales are down 65% from the 10 year average of 370 sales.
MOS in April increased to 8.5 from 3.6 in March and is up 16% from 7.4 MOS last April 2019.
The average price decreased 11% to $871K in April v. $978K in March and was down 2% from April 2019. The median price decreased 6% to $745K v $790K in March and is up slightly from last April. Average and median prices are down by 27% & 15% from the peak of $1.199M and $880K in January 2018.
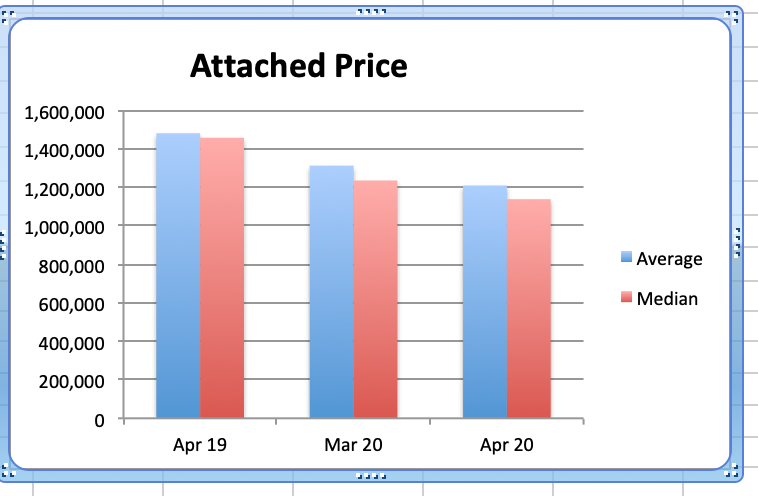
Westside townhouse supply decreased 3% this April (200 vs 207) from March and that's down 39% from 328 in April 2019. Demand in April is down 45% to 28 sales from 51 in March and that is down 36% from 44 sales last April 2019. Attached home sales are down 57% from the 10 year average of 65 sales.
With supply and demand down, current MOS increased to 7.1 from 4.1 in March. That is down 4% from 7.5 in April 2019.
Townhouse average prices in April were down 8% at $1.209M from March and were down 18% from $1.48M last April 2019. Median prices decreased 8% to $1.14M from $1.23M in March are down 22% from $1.46M in April 2019. Average prices are down by 32% from the peak of $1.8M in January 2018. Median prices are down 26% from the peak of $1.519M in January 2018.

While stats last month in March looked relatively positive, April numbers are now starting to show the negative effect of the Covid pandemic. Prices that were recovering since Feb. 2019 will now be taking another hit as sales volumes in detached, apartment and attached property sales are off by 74%, 65% and 57% from the 10 year averages. Detached home prices are off, on average 27%, Apartments are off 26% and Attached Homes are off 32% from the peak so all property types still appear to be good value for Buyers.
The Real Estate Board of Greater Vancouver (REBGV) reports that residential property sales in the region decreased 39.4% to 1109 this April from 1829 sales in April 2019. This is a 56.1% decrease from the 2524 homes sold in March. April 2020 sales were 62.7% below the 10-year April sales average.
The total number of properties currently offered on the MLS® system in Metro Vancouver is 9383, down 34.6% from 14357 in April 2019. This is down 2.3% from last month.
For all property types, the sales-to-active listings ratio for April 2020 is 11.8%.
Downward pressure on home prices occurs when the ratio dips below the 12% mark for a sustained period, while upward pressure occurs when it surpasses 20% over several months.
Regional numbers are below historical 10 year averages, so westside properties, even further below the the 10 year averages are better relative value. Current supply is down dramatically and while demand was up for the early part of March the rapid onset of the Covid19 pandemic has changed our world and many buyers and sellers are on hold pending an indication of the extent and duration of economic damage wrought by the disease.
March was caught in the middle of the realization of just how serious this pandemic is and April is starting to show us how low our sales volume can get. Usually a drop in demand would force prices down but the drop in supply is helping to keep the Months of Supply from exploding. The people who need to buy and sell will continue to do so while others may step back and wait for a sign.
This is a Buyers market so if you have been thinking of making a purchase the market factors are in your favour.
Happy Mother's Day!
Best regards,
Stuart