July 2019 Westside Market Update
Posted on Aug 07, 2019 in Market Update
The supply of Westside detached homes in July was 697, down 6.4% from 745 in June and down 13% compared to 840 in June 2018.
Westside detached home sales this July increased 30% from June (78 v 60) and were up 50% compared to 52 sales in July 2018. Sales are down 28% from the 10 year July average of 109 sales.

Months of Supply, (MOS) was down 28% fro...
June Westside Market Update
Posted on Jul 06, 2019 in Market Update
The supply of Westside detached homes in June was 745, up 2.5% from 727 in May and down 11% compared to 840 in June 2018.
Westside detached home sales this June decreased 28% from May (60 v 83) and were down 20% compared to 75 sales in June 2018. Sales are down 58% from the 10 year June average of 142 sales.

Months of Supply, (MOS) was up 42% from la...
May 2019 Westside Market Update
Posted on Jun 06, 2019 in Market Update
The supply of Westside detached homes in May was 727, down 1.4% from 737 in April and down 15% compared to 850 in May 2018.
Westside detached home sales this May increased 36% from April (83 v 61) and were down 7% compared to 89 sales in May 2018. Sales are down 50% from the 10 year May average of 165 sales.

Months of Supply, (MOS) was down 28% fr...
Apr 2019 Westside Market Update
Posted on May 07, 2019 in Market Update
The supply of Westside detached homes in April was 737, up 9.5% from 684 in March and down 2.4% compared to 684 in April 2018.
Westside detached home sales this April remained unchanged from March (61 v 62) and were down 10% compared to 66 sales in April 2018. Sales are down 61% from the 10 year April average of 157 sales.
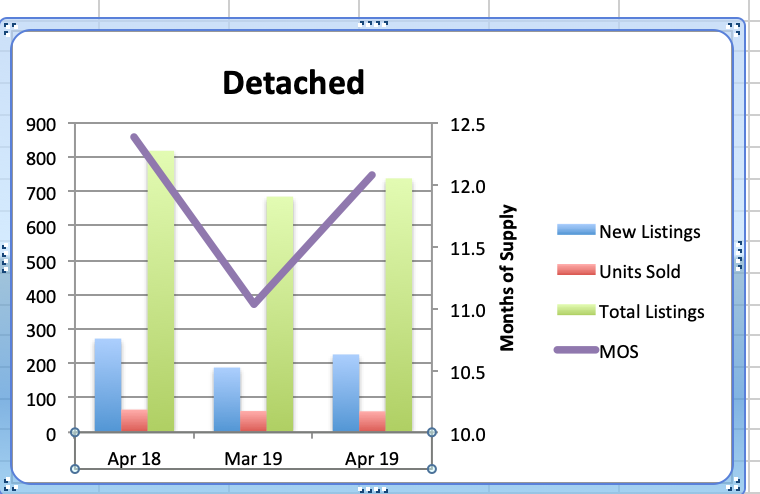
Months of Supply, (MOS) w...
Mar 2019 Westside Market Update
Posted on Apr 07, 2019 in Market Update
The supply of Westside detached homes in March was 684, down 4% from 713 in February and down 11% compared to 772 in March 2018.
Westside detached home sales this March were up 44% from February (62 from 43) and up 17% compared to 53 sales in March 2018. But even though March sales are up from last month and last year, they are still down 61% from t...
Jan 2019 Westside Market Update
Posted on Feb 09, 2019 in Market Update
The supply of Westside detached homes in January is unchanged from December (652) and up 6% compared to January 2018. Westside detached home sales (demand) this January were down 6% from December (34 from 32) and down 23% compared to 44 sales in January 2018. January sales are down 61% from the 10 year January average of 87 sales.

Months of Supply...